Financial Information
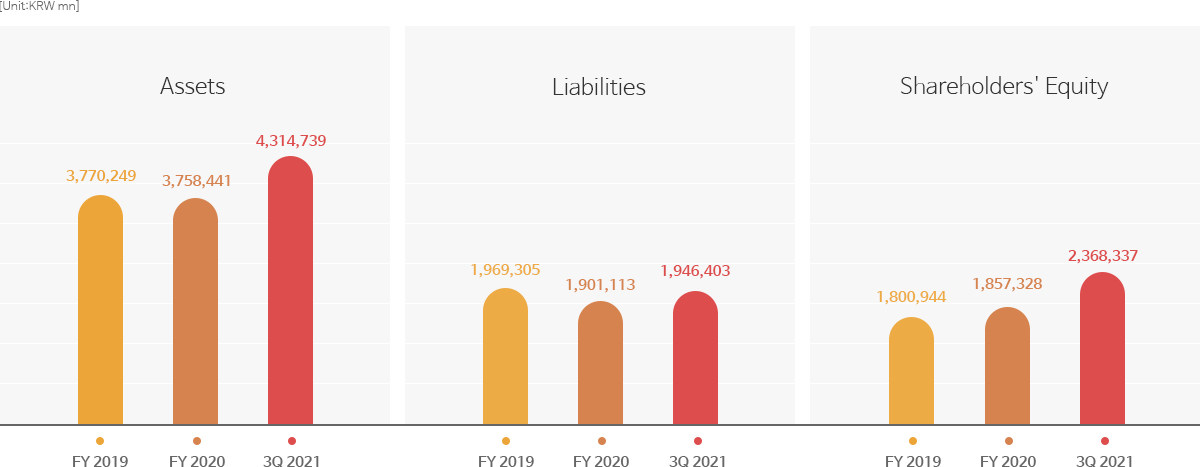
Assets
Liabilities
Shareholders' Equity
Current Assets
Cash & cash equivalents
Trade & other receivables
Inventories
Non-current Assets
PP&E
Intangible assets
Current Liabilities
Trade & other payables
Borrowings
Bond
Non-current Liabilities
Borrowings
Bond
Capital Stock
FY 2019 FY 2020 3Q 2021
3,770,249 3,758,441 4,314,739
1,586,809 1,686,064 2,086,588
232,032 470,648 726,346
521,047 518,469 637,073
735,481 615,552 618,172
2,183,439 2,072,377 2,228,152
439,052 405,236 419,850
1,547,923 1,450,747 1,557,491
1,969,305 1,901,113 1,946,403
867,356 995,460 994,195
413,004 407,881 525,680
236,394 355,990 302,543
63,568 - -
1,101,950 905,654 952,208
611,690 507,117 425,937
- - -
1,800,944 1,857,328 2,368,337
61,115 61,115 61,115
2021
2020
2019
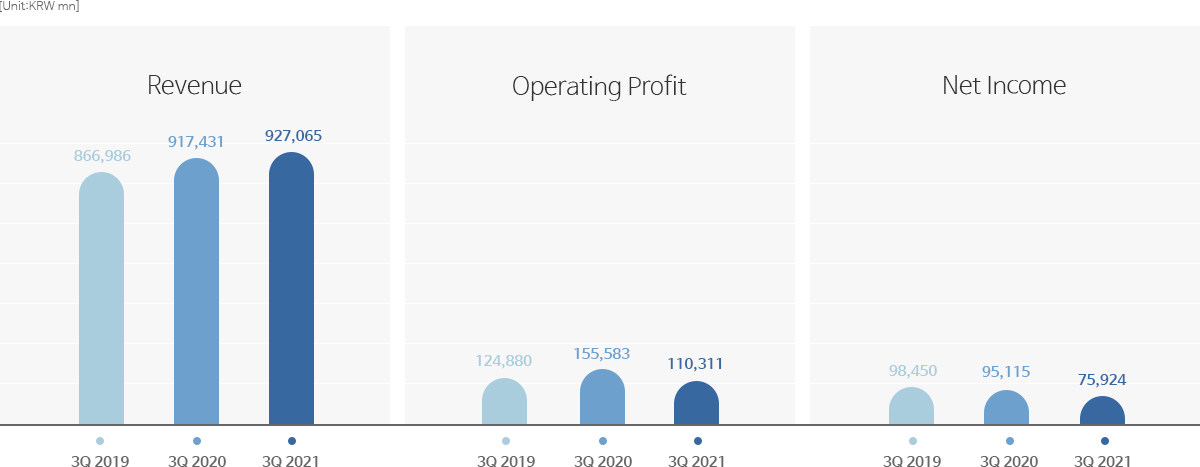
Revenue
Gross Profit
Operating Profit
Net Income
Revenue
Gross Profit
Operating Profit
Net Income
Revenue
Gross Profit
Operating Profit
Net Income
1Q 2Q 3Q 4Q Total
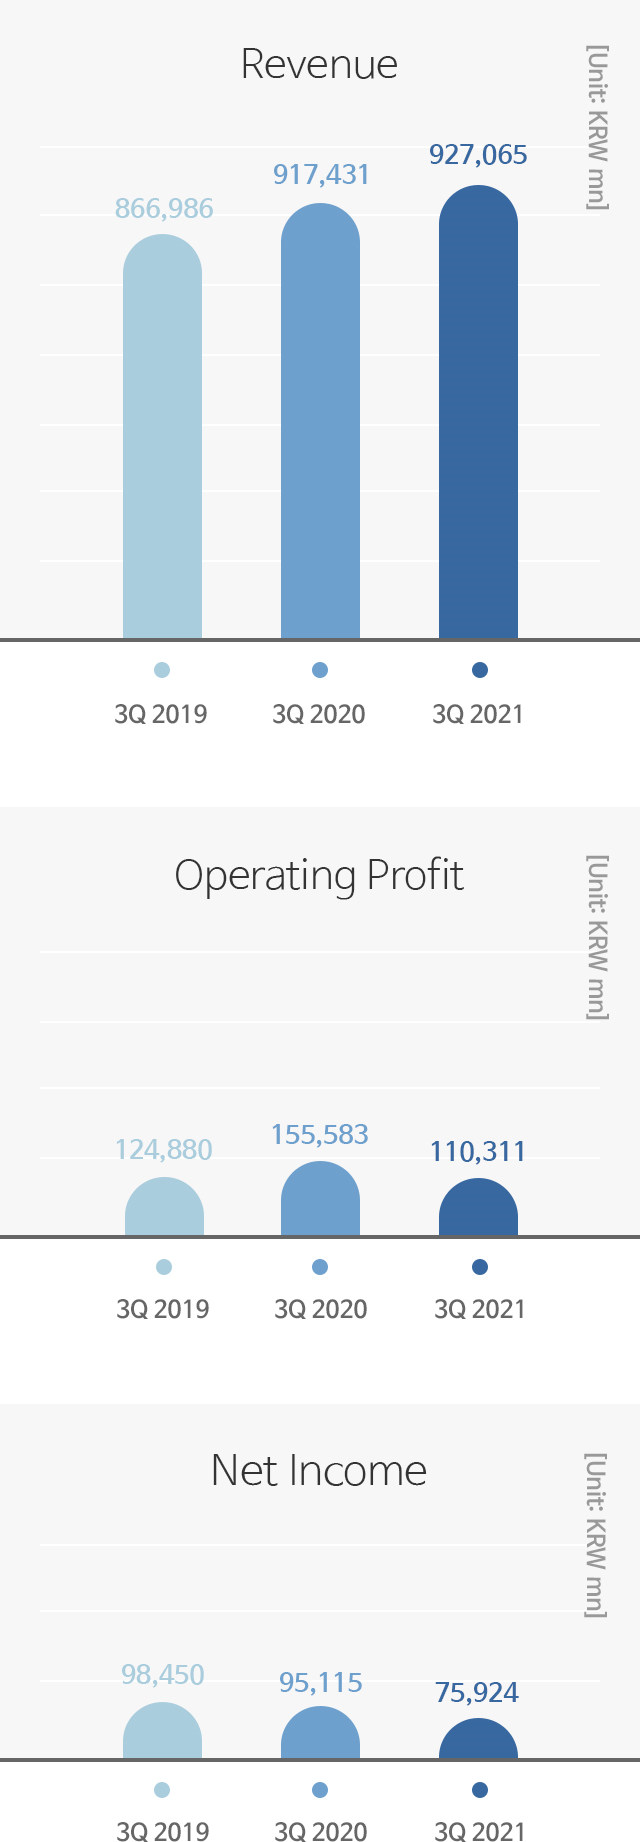
988,281 1,019,354 927,065 2,934,700
498,541 522,427 453,165 1,474,133
183,569 173,786 110,311 467,666
134,201 135,750 75,924 345,875
1Q 2Q 3Q 4Q Total
789,901 625,011 917,431 796,463 3,128,806
381,699 326,569 446,324 390,050 1,544,643
67,142 50,281 155,583 68,073 341,079
39,500 45,520 95,115 17,604 197,739
1Q 2Q 3Q 4Q Total
834,576 959,303 866,986 789,556 3,450,421
417,719 499,997 417,374 394,617 1,729,707
115,850 144,872 124,880 85,074 470,676
96,210 91,972 98,450 51,511 338,143
Face Value (Won)
(Consolidated) Net Profit (Million won)
(Consolidated) EPS (Won)
Types of Dividends
Total Dividend Amount in Cash (Million won)
Payout Ratio (%)
Dividend Yield (%) Common
Preferred
Cash Dividend Per Share (Won) Common
Preferred
2020 2019 2018 2017 2016
1,000 1,000 1,000 5,000 5,000
197,739 338,144 210,050 108,110 311,126
2,306 4,382 2,349 5,150 28,420
Cash Cash Cash Cash Cash
11,118 13,320 3,055 3,055 2,852
8.0 5.0 2.1 4.9 0.9
0.4 0.4 0.1 0.3 0.4
- - - - -
185 219 50 250 250
- - - - -

※ On May 2018, stock split from KRW 5,000 to KRW 1,000